Skeletons and time-indexed plots
Two layout helpers sit beside ordinary dagplot: undirected skeletons (CPDAG / PC-style output) and time-indexed grids for graphs unrolled over occasions.
Undirected skeletons
PC and related algorithms often return an undirected edge as a pair of opposing arrows. Plotting both looks like a cycle; collapse them first with digraph_skeleton, or use dagplot_skeleton so arrowheads stay off and edges use UNDIRECTED_EDGE_COLOR.
using Graphs, DAGMakie, CairoMakie

# Opposing arcs encode an undirected edge between X and Y; Z → X is directed.
g = SimpleDiGraph(3)
add_edge!(g, 1, 2)  # X → Y
add_edge!(g, 2, 1)  # Y → X  (undirected {X,Y})
add_edge!(g, 3, 1)  # Z → X

labels = ["X", "Y", "Z"]
# Z above X so reciprocal X–Y arcs stay clear of Z.
layout = Point2f[Point2f(-1, 0), Point2f(1, 0), Point2f(-1, 1.2)]

fig = Figure(size = (720, 280))
ax1 = Axis(fig[1, 1], title = "Directed (misleading)")
ax2 = Axis(fig[1, 2], title = "Skeleton")
dagplot!(ax1, g; labels = labels, layout = layout)
dagplot!(ax2, digraph_skeleton(g); labels = labels, layout = layout)
fig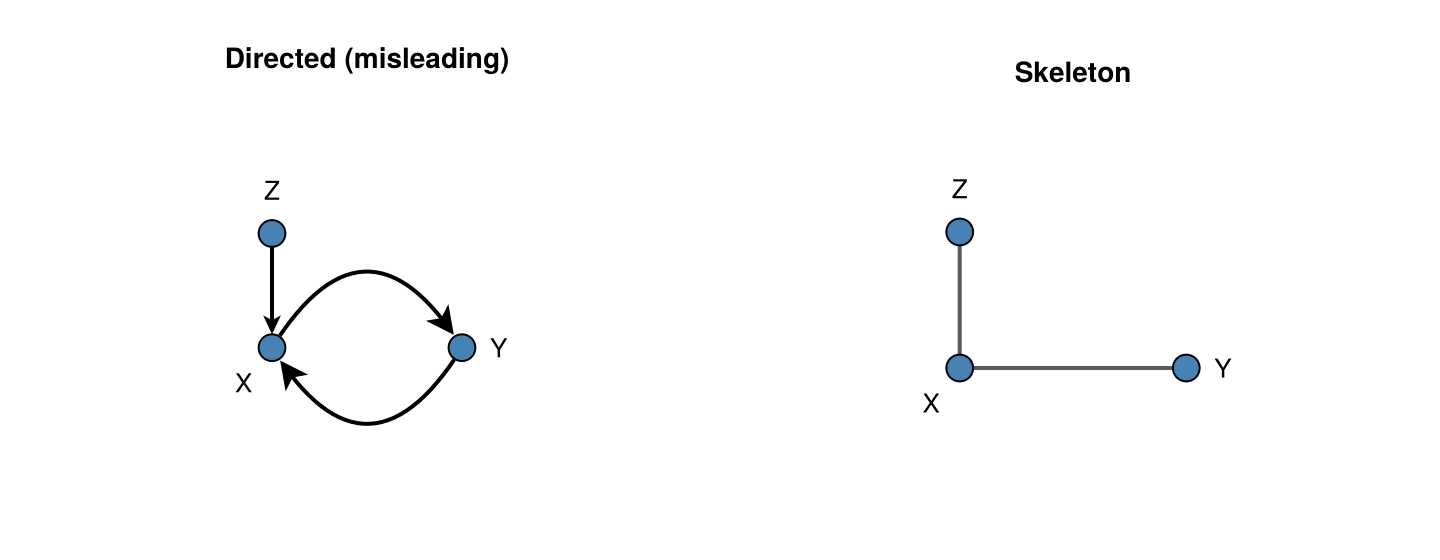
One-liner when you only need the skeleton figure:
fig, ax, p = dagplot_skeleton(g; labels = labels, layout = layout)
fig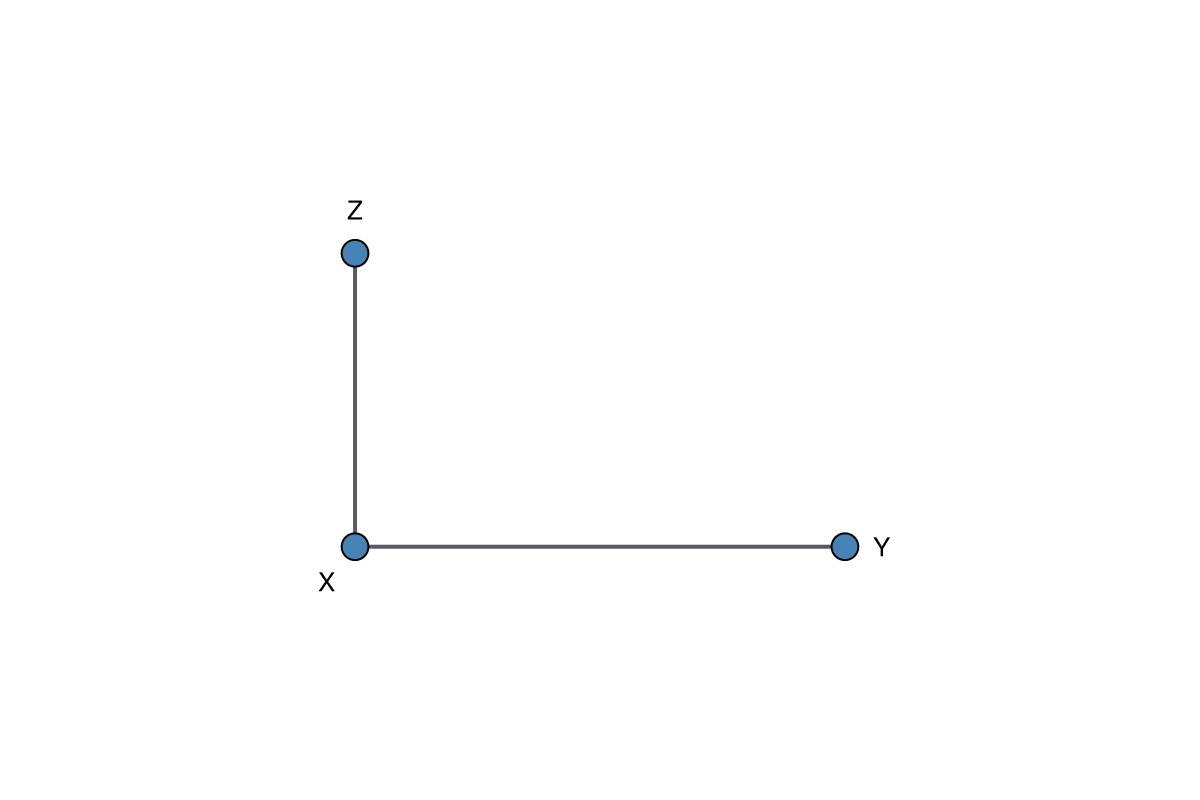
Passing an undirected SimpleGraph to dagplot / dagplot! also suppresses arrowheads and applies the undirected edge colour.
Relational graphs
CausalDynamics can ground a declared relational schema and skeleton to an ordinary directed graph whose node labels retain (entity type, instance, attribute) provenance. Plot that grounded graph with dagplot and pass those labels explicitly. DAGMakie does not infer relational mechanisms, identify effects across unseen skeletons, or decide whether a relation is causal; future plate/grouping helpers remain display-only.
Time-indexed unrolling
For a graph with n_variables × n_times nodes in CausalDynamics order (outer loop over occasions, inner loop over variables), use dagplot_time_indexed. Columns run left→right in time; rows are variables.
With color_by = :ancestors (or :ancestors_temporal), exposure and outcome roles propagate across each variable row so later occasions of the same variable keep treatment / outcome / ancestor colours (#5). Pass scalar node indices or (variable_index, time_index) tuples for exposure and outcome.
using Graphs, DAGMakie, CairoMakie

# W, A, Y × two occasions (CausalDynamics unroll order).
g = SimpleDiGraph(6)
add_edge!(g, 1, 2)  # W₁ → A₁
add_edge!(g, 1, 3)  # W₁ → Y₁
add_edge!(g, 4, 5)  # W₂ → A₂
add_edge!(g, 4, 6)  # W₂ → Y₂
add_edge!(g, 2, 5)  # A₁ → A₂
add_edge!(g, 2, 6)  # A₁ → Y₂

fig, ax, p = dagplot_time_indexed(
    g, 3, 2;
    labels = ["W₁", "A₁", "Y₁", "W₂", "A₂", "Y₂"],
    color_by = :ancestors,
    exposure = (2, 1),
    outcome = (3, 2),
    figure_size = (640, 260),
)
fig
For manual styling without the plot wrapper, use apply_node_type_styling or temporal_role_styling.
Mixed temporal layout and glyphs
When an unrolled graph reuses a single node for a from-onset attribute as well as pointwise state nodes, use dagplot_temporal with the graph's explicit node keys. A pointwise key is (variable, time); a reused node is (variable, nothing) and is placed at its onset time. Markers follow value_representation: only :interval_summary uses the rounded rectangle under the package convention. Attributes, trajectories, and from-onset supports remain circles unless you pass an explicit node_marker. Shape therefore never encodes enduring identity or node count. Show referent identity with labelled lanes or grouping, separately from causal arrows.
using Graphs, DAGMakie, CairoMakie

keys = [(:diagnosis, 0), (:pasture, nothing), (:weight, 0), (:weight, 1)]
g = SimpleDiGraph(4)
add_edge!(g, 1, 2)  # diagnosis[0] → pasture
add_edge!(g, 1, 3)  # diagnosis[0] → weight[0]
add_edge!(g, 2, 4)  # pasture → weight[1]

fig, ax, p = dagplot_temporal(
    g,
    keys;
    onset_times = [0, 1, 0, 0],  # placement of the single-node key (:pasture, nothing)
    value_representations = [:state, :attribute, :state, :state],
    labels = ["diagnosis[0]", "pasture", "weight[0]", "weight[1]"],
)
fig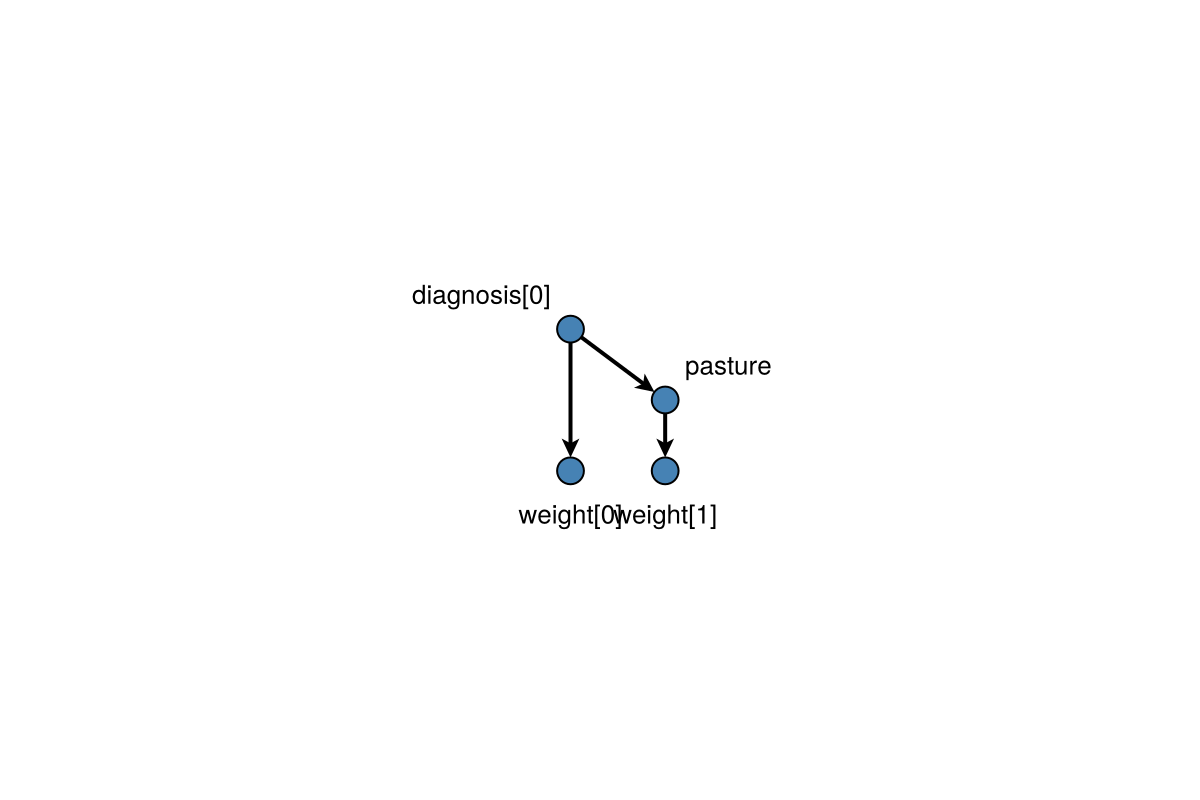
Spacing keywords dx and dy stretch columns and rows. For a TemporalUnrolling from CausalDynamics.jl, prefer dagplot_temporal(unrolling) after using DAGMakie (labels via temporal_node_label; markers from value_representation / CausalDynamics extension).
The display layer does not infer temporal provenance. When an auditable distinction is needed, obtain records from CausalDynamics with temporal_edge_records(unrolling) and use the role field to annotate or inspect the figure: :constitutive records form a single-node attribute, :recurrent_influence records reuse it at later times, and :pointwise_influence records connect pointwise nodes. Passing these records to plotting code is display metadata; it must not create alias vertices or change the graph used for identification. Prefer marker_for_value_representation when representation is known. do_surgery on process/semantic graph_kind requires allow_non_causal=true or an explicit causal projection.
See also
- Visual Grammar — DiD SWIGs and interaction IDAGs
- Node Types & Styling —
EffectMeasure/SwigFixedcolours - Basic Plotting —
layout_modeand generaldagplotoptions