Skeletons and time-indexed plots
Two layout helpers sit beside ordinary dagplot: undirected skeletons (CPDAG / PC-style output) and time-indexed grids for graphs unrolled over occasions.
Undirected skeletons
PC and related algorithms often return an undirected edge as a pair of opposing arrows. Plotting both looks like a cycle; collapse them first with digraph_skeleton, or use dagplot_skeleton so arrowheads stay off and edges use UNDIRECTED_EDGE_COLOR.
using Graphs, DAGMakie, CairoMakie

# Opposing arcs encode an undirected edge between X and Y; Z → X is directed.
g = SimpleDiGraph(3)
add_edge!(g, 1, 2)  # X → Y
add_edge!(g, 2, 1)  # Y → X  (undirected {X,Y})
add_edge!(g, 3, 1)  # Z → X

labels = ["X", "Y", "Z"]
# Z above X so reciprocal X–Y arcs stay clear of Z.
layout = Point2f[Point2f(-1, 0), Point2f(1, 0), Point2f(-1, 1.2)]

fig = Figure(size = (720, 280))
ax1 = Axis(fig[1, 1], title = "Directed (misleading)")
ax2 = Axis(fig[1, 2], title = "Skeleton")
dagplot!(ax1, g; nlabels = labels, layout = layout)
dagplot!(ax2, digraph_skeleton(g); nlabels = labels, layout = layout)
fig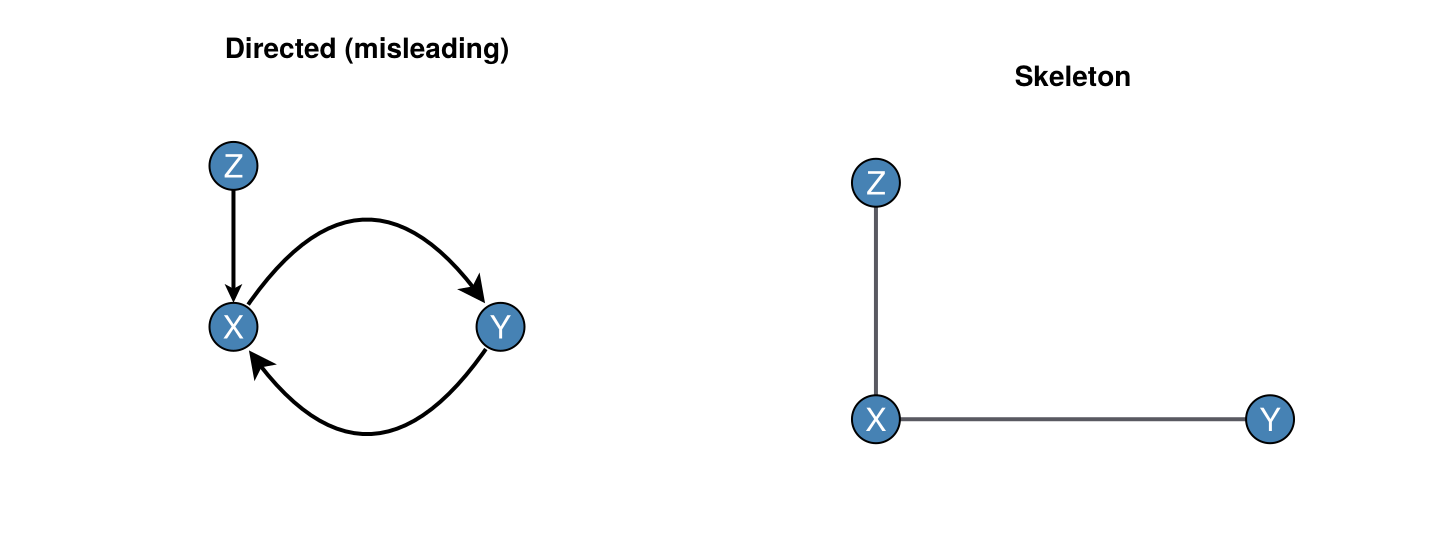
One-liner when you only need the skeleton figure:
fig, ax, p = dagplot_skeleton(g; nlabels = labels, layout = layout)
fig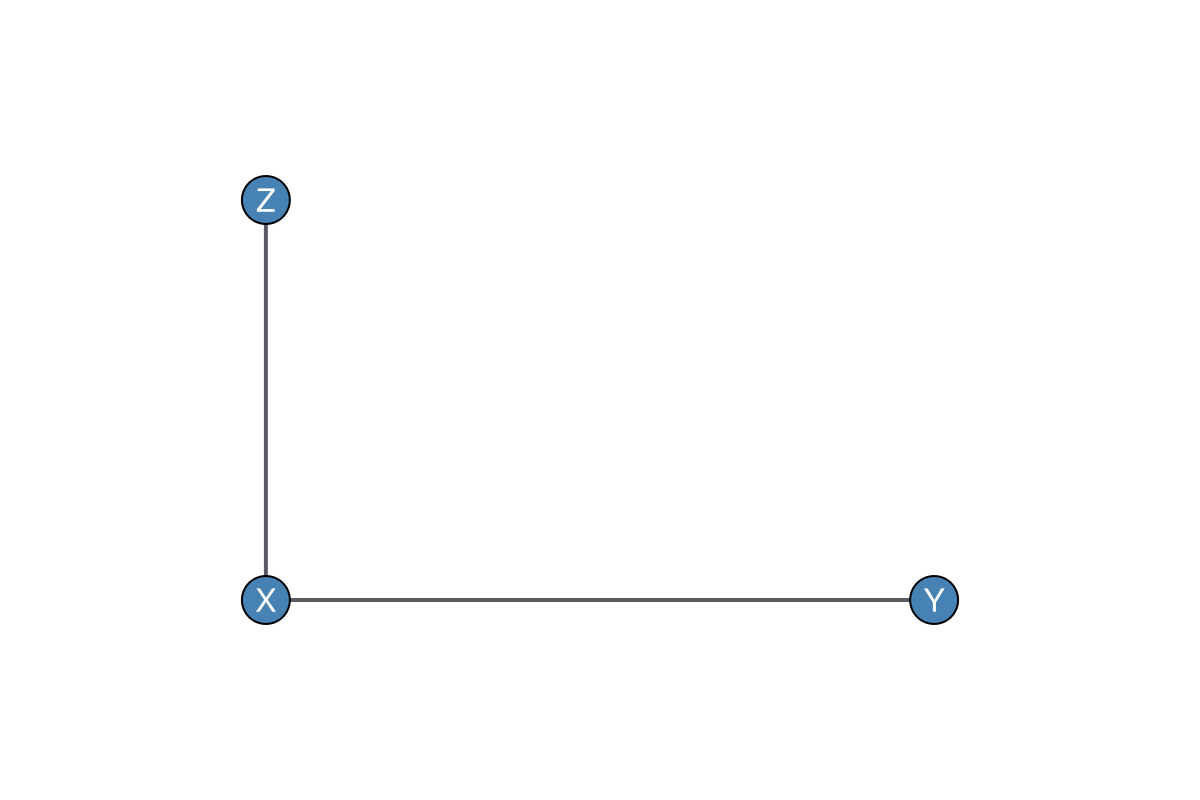
Passing an undirected SimpleGraph to dagplot / dagplot! also suppresses arrowheads and applies the undirected edge colour.
Time-indexed unrolling
For a graph with n_variables × n_times nodes in CausalDynamics order (outer loop over occasions, inner loop over variables), use dagplot_time_indexed. Columns run left→right in time; rows are variables. Colour and stroke can follow node roles (here $A$ as treatment, $B$ as outcome) via apply_node_type_styling.
using Graphs, DAGMakie, CairoMakie

# Two variables (A, B), three occasions. Nodes: A₁, B₁, A₂, B₂, A₃, B₃.
g = SimpleDiGraph(6)
add_edge!(g, 1, 3)  # A₁ → A₂
add_edge!(g, 3, 5)  # A₂ → A₃
add_edge!(g, 2, 4)  # B₁ → B₂
add_edge!(g, 4, 6)  # B₂ → B₃
add_edge!(g, 1, 4)  # A₁ → B₂
add_edge!(g, 3, 6)  # A₂ → B₃

types = [Treatment, Outcome, Treatment, Outcome, Treatment, Outcome]
colors, markers, strokewidths = apply_node_type_styling(types)

fig, ax, p = dagplot_time_indexed(
    g, 2, 3;
    nlabels = ["A₁", "B₁", "A₂", "B₂", "A₃", "B₃"],
    node_color = colors,
    node_marker = markers,
    node_strokewidth = strokewidths,
    figure_size = (640, 260),
)
fig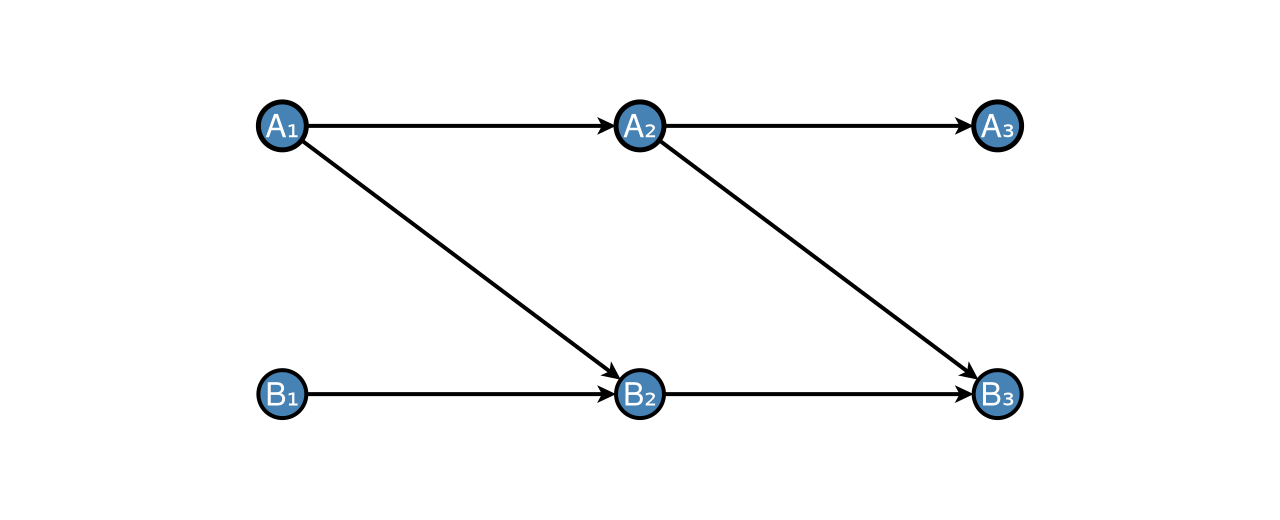
Spacing keywords dx and dy stretch columns and rows. For a TemporalUnrolling from CausalDynamics.jl, prefer CausalDynamics.dagplot_temporal(unrolling) (labels come from temporal_node_label).
See also
- Visual Grammar — DiD SWIGs and interaction IDAGs
- Node Types & Styling —
EffectMeasure/SwigFixedcolours - Basic Plotting —
layout_modeand generaldagplotoptions