7  Identification: When Can We Learn from Data?

Status: Draft

v0.6

7.1 Introduction

Not all causal questions can be answered from observational data (Pearl 2009; Shpitser and Pearl 2006; Rothman et al. 2021). This chapter builds the core mindset: estimand → identification → estimator. In the Structural stratum, we ask: when can we identify perfect prehensive relations (edge structure) (the ideal causal structure) from observable data?

7.2 The Three-Step Framework

7.2.1 1. Estimand

What do we want to estimate?

Example: Average treatment effect (ATE) \[ \text{ATE} = \mathbb{E}[Y^{do(A=1)}] - \mathbb{E}[Y^{do(A=0)}] \]

In the Structural stratum, we seek to identify perfect causal relations, the ideal forms toward which systems tend.

7.2.2 2. Identification

Can we express the estimand in terms of observable distributions? (Pearl 2009; Shpitser and Pearl 2006)

Identification asks: Is \(P^{do(A=a)}(Y)\) expressible as a function of \(P(Y, A, X)\)?

If yes, the estimand is identified. If no, it is not identified (or only partially identified).

From a Whiteheadian perspective, these graphical criteria work because they reason about prehensive relations (edges) encoded in the graph structure (see Graph Theory and Causal Patterns). The backdoor criterion identifies which edges need to be blocked to isolate causal effects. The edge structure (representing which prehensive relations exist) determines what can be learned from observations and what requires interventions.

7.2.3 3. Estimator

How do we estimate the identified quantity from finite data?

Once identified, we can construct estimators. Common approaches include:

TMLE is particularly valuable because it:

  • Is double robust: Consistent if either outcome or treatment model is correct
  • Achieves semiparametric efficiency: Optimal variance among regular asymptotically linear estimators
  • Can incorporate machine learning: Flexible models (e.g., Super Learner (Laan et al. 2007)) for outcome and treatment
  • Provides valid inference: Confidence intervals and hypothesis tests
  • Handles complex data: High-dimensional confounders, missing data, near-positivity violations

For details on TMLE implementation, see TMLE and Doubly Robust Estimation.

7.3 Graphical Criteria: Adjustment Logic

Given a causal graph, we can determine identification using adjustment criteria (Pearl 2009):

These criteria rely on the graph structure established in Graph Theory and Causal Patterns.

7.3.1 Implementation: Checking identification in code

The criteria above are conceptual. In the worked examples we use the book’s Julia stack (backdoor_adjustment_set, find_backdoor_paths, …, and the unified certificate API identify) so the same logic executes. Where a package helper is the graphical rule (e.g. path blocking), a short source excerpt follows the API demo. Package manuals document the full API; this chapter develops when identification succeeds.

7.3.1.1 Backdoor Criterion

The backdoor criterion identifies valid adjustment sets for estimating causal effects. Low-level helpers and the IdentificationResult from identify agree; the certificate is what downstream estimation (CausalTargeted, TMLE bridges) consumes:

# Find project root and include ensure_packages.jl
project_root = let
    current = pwd()
    while !isfile(joinpath(current, "Project.toml")) && !isfile(joinpath(current, "_quarto.yml"))
        parent = dirname(current)
        parent == current && break
        current = parent
    end
    current
end
include(joinpath(dirname(Base.active_project()), "scripts", "book_bootstrap.jl"))
@auto_using DAGMakie CairoMakie CausalDynamics Graphs

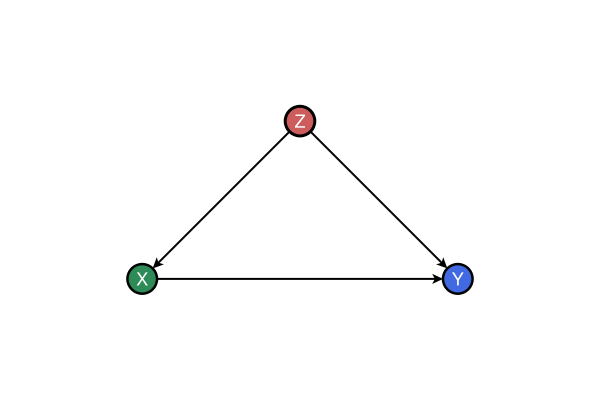
# Confounding example: Z → X → Y, Z → Y
g, labels = confounding_graph(["Z", "X", "Y"])  # 1=Z, 2=X, 3=Y

# Low-level criterion (node indices)
adj_set = backdoor_adjustment_set(g, 2, 3)
println("Backdoor adjustment set: ", adj_set)  # Set([1]) = {Z}
println("Backdoor adjustable: ", is_backdoor_adjustable(g, 2, 3))  # true

# Certificate API: vector node_names maps index i → name
id_xy = identify(g, TotalEffectQuery(2, 3); node_names = [:Z, :X, :Y])
println("identify strategy: ", id_xy.strategy,
    "; adjustment: ", id_xy.adjustment,
    "; identifiable: ", id_xy.identifiable)
Backdoor adjustment set: Set([1])
Backdoor adjustable: true
identify strategy: backdoor; adjustment: [:Z]; identifiable: true

The figure below uses DAGMakie’s dagitty-style smart colouring: ancestral roles relative to treatment and outcome, with the certificate’s adjustment set emphasised (smart = :adjustment).

Backdoor adjustment under smart colouring: exposure \(X\) (seagreen), outcome \(Y\) (royal blue), shared ancestor \(Z\) (indian red) with adjustment emphasis (smart = :adjustment using the identification certificate).
NoteFrom CausalDynamics.jl

Public helpers such as backdoor_adjustment_set and d_separated compose with CausalInference. Under the hood, path enumeration asks a small, readable question: given a node sequence, does the conditioning set \(Z\) block it? Colliders and non-colliders are handled differently, matching the graphical rules in this chapter.

# packages/CausalDynamics.jl/src/graphs/d_separation.jl (excerpt; internal helper)
function _is_path_blocked(g::AbstractGraph, path::Vector{Int}, Z::Set)
    n = length(path)
    n < 3 && return false

    for i in 2:(n - 1)
        node = path[i]
        prev, nxt = path[i - 1], path[i + 1]
        is_collider = has_edge(g, prev, node) && has_edge(g, nxt, node)
        if is_collider
            # Collider: blocked unless the collider (or a descendant) is in Z
            if node in Z
                continue
            end
            desc = get_descendants(g, node)
            if !isempty(intersect(desc, Z))
                continue
            end
            return true
        else
            # Chain or fork: blocked if the middle node is in Z
            if node in Z
                return true
            end
        end
    end
    return false
end

Read the branch structure as the textbook rule. Prefer the public API (d_separated, backdoor_adjustment_set, identify) in your own code; this helper is shown because the syntax is the criterion.

7.3.1.2 Frontdoor Criterion

The frontdoor criterion uses mediators when direct adjustment isn’t possible:

# Find project root and include ensure_packages.jl
project_root = let
    current = pwd()
    while !isfile(joinpath(current, "Project.toml")) && !isfile(joinpath(current, "_quarto.yml"))
        parent = dirname(current)
        parent == current && break
        current = parent
    end
    current
end
include(joinpath(project_root, "scripts", "ensure_packages.jl"))
@auto_using DAGMakie CairoMakie CausalDynamics Graphs

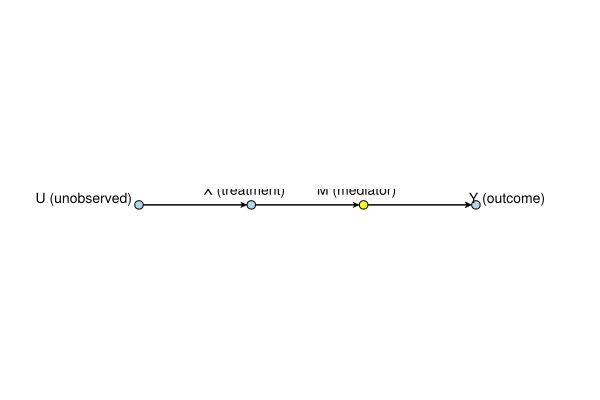
# Frontdoor example: U → X → M → Y, U → Y
# Nodes: 1=U, 2=X, 3=M, 4=Y
g = DiGraph(4)
add_edge!(g, 1, 2)  # U → X
add_edge!(g, 1, 4)  # U → Y
add_edge!(g, 2, 3)  # X → M
add_edge!(g, 3, 4)  # M → Y

# Check if M is a valid frontdoor adjustment set
is_valid = frontdoor_adjustment_set(g, 2, 4, [3])
println("M is valid frontdoor adjustment: ", is_valid)  # true

# Find potential frontdoor mediators
mediators = find_frontdoor_mediators(g, 2, 4)
println("Frontdoor mediators: ", mediators)  # [Set([3])]

# Visualise: U above, X → M → Y along the base (avoids collinear layered layout)
let
    fig, ax, p = dagplot(g;
        figure_size = (600, 400),
        layout = Point2f[
            Point2f(0.0, 1.0),   # U
            Point2f(-1.5, 0.0),  # X
            Point2f(0.0, 0.0),   # M
            Point2f(1.5, 0.0),   # Y
        ],
        node_color = [
            RGBf(0.85, 0.65, 0.05),
            RGBf(0.30, 0.55, 0.70),
            RGBf(0.20, 0.55, 0.45),
            RGBf(0.30, 0.55, 0.70),
        ],
        nlabels = ["U", "X", "M", "Y"],
        node_size = 40,
        edge_width = 2.0,
        arrow_size = 15,
        nlabels_fontsize = 16,
        nlabels_color = :white,
        nlabels_align = (:center, :center),
        nlabels_distance = 0,
        auto_align_labels = false,
        padding = 0.40,
    )
    fig  # Only this gets displayed
end
M is valid frontdoor adjustment: true
Frontdoor mediators: Set{Int64}[Set([3])]

Frontdoor adjustment example: mediator M blocks the path X → M → Y

7.3.1.3 Instrumental Variables

Instrumental variables provide identification when direct adjustment isn’t possible:

# Find project root and include ensure_packages.jl
project_root = let
    current = pwd()
    while !isfile(joinpath(current, "Project.toml")) && !isfile(joinpath(current, "_quarto.yml"))
        parent = dirname(current)
        parent == current && break
        current = parent
    end
    current
end
include(joinpath(project_root, "scripts", "ensure_packages.jl"))
@auto_using DAGMakie CairoMakie CausalDynamics Graphs

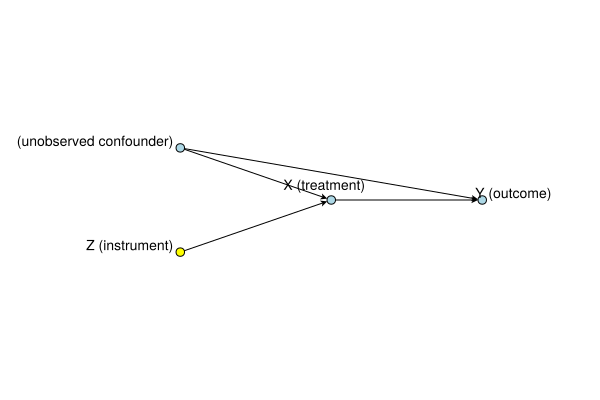
# IV example: Z → X → Y, U → X, U → Y
# Nodes: 1=Z, 2=X, 3=Y, 4=U
g = DiGraph(4)
add_edge!(g, 1, 2)  # Z → X
add_edge!(g, 2, 3)  # X → Y
add_edge!(g, 4, 2)  # U → X
add_edge!(g, 4, 3)  # U → Y

# Find instrumental variables for X → Y
instruments = find_instruments(g, 2, 3)
println("Valid instruments: ", instruments)  # [1] = {Z}

# Visualise: Z → X → Y on the base, U above (confounder of X and Y)
let
    fig, ax, p = dagplot(g;
        figure_size = (600, 400),
        layout = Point2f[
            Point2f(-1.5, 0.0),  # Z
            Point2f(0.0, 0.0),   # X
            Point2f(1.5, 0.0),   # Y
            Point2f(0.75, 1.0),  # U
        ],
        node_color = [
            RGBf(0.85, 0.65, 0.05),
            RGBf(0.30, 0.55, 0.70),
            RGBf(0.30, 0.55, 0.70),
            RGBf(0.85, 0.65, 0.05),
        ],
        nlabels = ["Z", "X", "Y", "U"],
        node_size = 40,
        edge_width = 2.0,
        arrow_size = 15,
        nlabels_fontsize = 16,
        nlabels_color = :white,
        nlabels_align = (:center, :center),
        nlabels_distance = 0,
        auto_align_labels = false,
        padding = 0.40,
    )
    fig  # Only this gets displayed
end
Valid instruments: [1]

Instrumental variable example: Z is a valid instrument for X → Y

7.3.1.4 Time-Varying Confounding Example

# Find project root and include ensure_packages.jl
project_root = let
    current = pwd()
    while !isfile(joinpath(current, "Project.toml")) && !isfile(joinpath(current, "_quarto.yml"))
        parent = dirname(current)
        parent == current && break
        current = parent
    end
    current
end
include(joinpath(project_root, "scripts", "ensure_packages.jl"))
@auto_using DAGMakie CairoMakie CausalDynamics Graphs

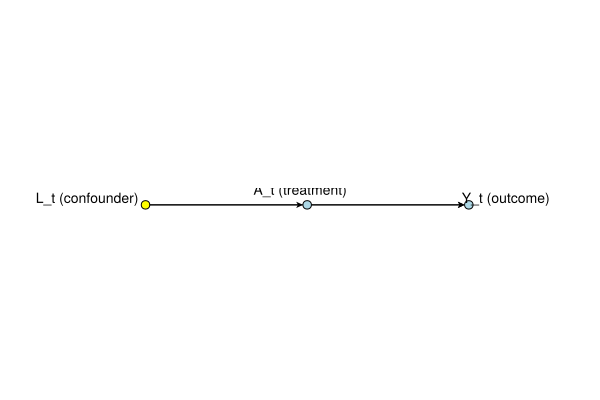
# Time-varying confounding: L_t → A_t → Y_t, L_t → Y_t
g, _ = confounding_graph(["L_t", "A_t", "Y_t"])  # 1=L_t, 2=A_t, 3=Y_t

# Find backdoor adjustment set for A_t → Y_t
adj_set = backdoor_adjustment_set(g, 2, 3)
println("Adjustment set: ", adj_set)  # Set([1]) = {L_t}

# Verify d-separation: A_t and Y_t are d-separated by L_t
println("A_t ⫫ Y_t | L_t: ", CausalDynamics.d_separated(g, 2, 3, [1]))  # true

# Visualise with triangle layout so L_t → Y_t is visible
let
    fig, ax, p = dagplot(g;
        figure_size = (600, 400),
        layout = Point2f[Point2f(0.0, 1.0), Point2f(-1.0, 0.0), Point2f(1.0, 0.0)],
        node_color = [RGBf(0.85, 0.65, 0.05), RGBf(0.30, 0.55, 0.70), RGBf(0.30, 0.55, 0.70)],
        nlabels = ["L_t", "A_t", "Y_t"],
        node_size = 42,
        edge_width = 2.0,
        arrow_size = 16,
        nlabels_fontsize = 18,
        nlabels_color = :white,
        nlabels_align = (:center, :center),
        nlabels_distance = 0,
        auto_align_labels = false,
        padding = 0.40,
    )
    fig  # Only this gets displayed
end
Adjustment set: Set([1])
A_t ⫫ Y_t | L_t: false

Time-varying confounding: L_t blocks the backdoor path A_t ← L_t → Y_t

7.3.2 Template-Based vs Symbolic Identification

The adjustment criteria above are template-based methods, they provide specific graphical patterns that guarantee identification. However, not all identification problems fit these templates.

Do-calculus provides a symbolic approach to identification (Pearl 2009; Shpitser and Pearl 2006). It consists of three rules that allow us to manipulate interventional distributions algebraically (see Do-Calculus: Rules for Interventions):

  1. Insertion/deletion of observations: When certain conditional independences hold
  2. Action/observation exchange: When interventions and observations are equivalent
  3. Insertion/deletion of actions: When interventions don’t affect certain variables

Do-calculus provides a complete (though not always efficient) method for determining identifiability: if a causal effect is identifiable, do-calculus can find an expression for it in terms of observable distributions. If do-calculus cannot find such an expression, the effect is not identifiable (Pearl 2009).

While template-based methods (backdoor, frontdoor, etc.) are often more intuitive and computationally efficient, do-calculus provides the theoretical foundation and handles cases where templates don’t apply.

7.4 Worked example: poultry oocyst assay

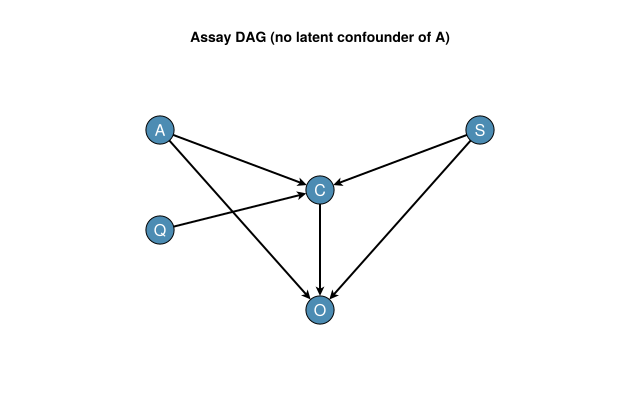
Identification is clearest on a concrete DAG that you can simulate. Consider a captive poultry trial: anticoccidial treatment \(A\), sex \(S\), forage quality \(Q\), body condition \(C\), and log oocyst count \(O\) (a continuous assay of gut parasite pressure). The assumed mechanisms are

\[ \begin{aligned} A &\coloneqq U_A, \\ S &\coloneqq U_S, \\ Q &\coloneqq U_Q, \\ C &\coloneqq \alpha_A A + \alpha_S S + \alpha_Q Q + U_C, \\ O &\coloneqq \beta_A A + \beta_S S + \beta_C C + U_O, \end{aligned} \]

so treatment affects the assay both directly and through condition. There is no backdoor into \(A\): total effects of \(A\) on \(O\) need no adjustment. Controlled direct effects that hold \(C\) fixed require conditioning on \(C\) (and on other open parents of \(O\) under that query). The next section develops natural direct and indirect effects more carefully; here we stay with interventional contrasts and graph checks.

include(joinpath(dirname(Base.active_project()), "scripts", "book_bootstrap.jl"))
@auto_using DAGMakie CairoMakie CausalDynamics Graphs Random Statistics

# Nodes: 1=A, 2=S, 3=Q, 4=C, 5=O
g_oocyst = SimpleDiGraph(5)
add_edge!(g_oocyst, 1, 4)  # A → C
add_edge!(g_oocyst, 1, 5)  # A → O
add_edge!(g_oocyst, 2, 4)  # S → C
add_edge!(g_oocyst, 2, 5)  # S → O
add_edge!(g_oocyst, 3, 4)  # Q → C
add_edge!(g_oocyst, 4, 5)  # C → O
labels_oocyst = ["A", "S", "Q", "C", "O"]
layout_oocyst = Point2f[
    Point2f(-1.6, 0.8),  # A
    Point2f(1.6, 0.8),   # S
    Point2f(-1.6, -0.2), # Q
    Point2f(0.0, 0.2),   # C
    Point2f(0.0, -1.0),  # O
]

α_A, α_S, α_Q = 1.2, 0.7, 1.1
β_A, β_S, β_C = 0.05, 0.8, 1.3
equations_oocyst = Dict{Int, Function}(
    1 => (u) -> u,
    2 => (u) -> u,
    3 => (u) -> u,
    4 => (a, s, q, u) -> α_A * a + α_S * s + α_Q * q + u,
    5 => (a, s, c, u) -> β_A * a + β_S * s + β_C * c + u,
)
scm_oocyst = GraphSCM(g_oocyst, equations_oocyst, Set{Int}())
GraphSCM(SimpleDiGraph{Int64}(6, [[4, 5], [4, 5], [4], [5], Int64[]], [Int64[], Int64[], Int64[], [1, 2, 3], [1, 2, 4]]), Dict{Int64, Function}(5 => var"#44#45"(), 4 => var"#42#43"(), 2 => var"#38#39"(), 3 => var"#40#41"(), 1 => var"#36#37"()), Set{Int64}())

Poultry oocyst assay DAG: anticoccidial \(A\), sex \(S\), forage quality \(Q\), body condition \(C\), log oocyst count \(O\). Treatment reaches \(O\) both directly and via \(C\).

7.4.1 Implied independencies and adjustment

# Association-layer checks implied by the DAG
println("A ⫫ S: ", CausalDynamics.d_separated(g_oocyst, 1, 2, Int[]))
println("A ⫫ Q: ", CausalDynamics.d_separated(g_oocyst, 1, 3, Int[]))
println("Q ⫫ O | C, A, S: ", CausalDynamics.d_separated(g_oocyst, 3, 5, [4, 1, 2]))

# Total effect A → O: empty backdoor set (A has no parents / no confounders)
adj_total = backdoor_adjustment_set(g_oocyst, 1, 5)
println("Backdoor set for total A→O: ", adj_total)

# Direct edge A→O remains open given C and S, so A ⫫̸ O | C, S in the observational graph
println("A ⫫ O | C, S? ", CausalDynamics.d_separated(g_oocyst, 1, 5, [4, 2]))
A ⫫ S: true
A ⫫ Q: true
Q ⫫ O | C, A, S: true
Backdoor set for total A→O: Set{Int64}()
A ⫫ O | C, S? false

7.4.2 Simulate, intervene, contrast

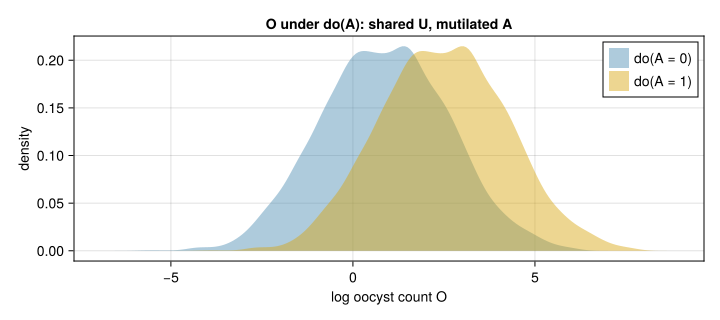
Draw exogenous noise for many birds, then compare means under \(do(A=1)\) versus \(do(A=0)\) with the same \(\mathbf{u}\) draws. Because mechanisms are linear, the Monte Carlo total effect recovers \(\beta_A + \beta_C\alpha_A\). Controlled and natural direct effects need extra structure (see mediation below); here we only identify the total interventional contrast.

rng = Random.Xoshiro(2026)
n = 4000
function draw_U(rng)
    Dict(
        1 => Float64(rand(rng) < 0.5),  # observational A ~ Bern(0.5)
        2 => Float64(rand(rng) < 0.5),  # S
        3 => randn(rng),                 # Q
        4 => 0.25 * randn(rng),          # U_C
        5 => 0.35 * randn(rng),          # U_O
    )
end

Us = [draw_U(rng) for _ in 1:n]
scm_A1 = apply_intervention(scm_oocyst, do_intervention(1, 1.0))
scm_A0 = apply_intervention(scm_oocyst, do_intervention(1, 0.0))
O_do1 = [simulate_scm(scm_A1, U)[5] for U in Us]
O_do0 = [simulate_scm(scm_A0, U)[5] for U in Us]
τ_hat = mean(O_do1) - mean(O_do0)
τ_true = β_A + β_C * α_A
println("Monte Carlo total effect = ", round(τ_hat; digits = 3))
println("Structural total effect β_A + β_C α_A = ", round(τ_true; digits = 3))
Monte Carlo total effect = 1.61
Structural total effect β_A + β_C α_A = 1.61

Interventional distributions of log oocyst count under \(do(A=0)\) and \(do(A=1)\) for the same exogenous draws. The gap estimates the total effect of anticoccidial treatment.

7.4.3 From identification to estimation (RxInfer and Turing)

The Monte Carlo contrast above uses the true SCM. On observational rows \((A,O)\) the same total effect is identified (empty backdoor). Two Julia heads estimate \(\tau\):

  • RxInfer / GraphPPL via CausalDynamics infer_backdoor_effect (variational message passing on a demeaned Gaussian slope; typically \(\lt 0.3\,\mathrm{s}\) for \(n=2000\) after warmup)
  • Turing NUTS on \(O_i \sim \mathcal{N}(\mu_0 + \tau A_i, \sigma)\) for a small-\(n\) check
TipWhen to use RxInfer (VI) versus Turing (MCMC)

Both engines answer Bayesian questions; they differ in model class and cost.

Prefer RxInfer / GraphPPL (variational message passing) when:

  • the generative head is (or can be reduced to) a conjugate / factorised model after residualisation (e.g. CausalDynamics infer_backdoor_effect on demeaned \((y,x)\))
  • \(N\) is large and you need a fast posterior summary for a scalar effect \(\tau\) or a low-dimensional latent
  • you already sit on an AgeSCM-style pipeline: encoder → → GraphPPL head

Prefer Turing (NUTS or other MCMC) when:

  • the likelihood is non-conjugate, hierarchical, or otherwise awkward for the current GraphPPL factors (abduction soft likelihoods, partial pooling, experimental-design comparisons)
  • you need a joint posterior over several parameters, or a small-\(n\) check against a VI mean
  • you want posterior predictive replicates drawn from full MCMC (Ch. 21)

Also in the stack (not a PPL choice): for latent trajectories, prefer filters / smoothers / StateSpaceDynamics Laplace before either PPL; use Turing only on short series or for parameter blocks once the path is handled.

Rule of thumb: conjugate tabular ATE and belief updates → RxInfer; flexible or pedagogical continuous models → Turing; long dynamical latent paths → SSM tooling first. Local timings live in scripts/bayesian_benchmarks.jl.

using DataFrames
using RxInfer
using Turing: Turing, @model, sample, NUTS
using Distributions
using Statistics

rows = [simulate_scm(scm_oocyst, U) for U in Us]
df_oocyst = DataFrame(
    A = [r[1] for r in rows],
    S = [r[2] for r in rows],
    Q = [r[3] for r in rows],
    C = [r[4] for r in rows],
    O = [r[5] for r in rows],
)
nm = Dict(1 => :A, 2 => :S, 3 => :Q, 4 => :C, 5 => :O)

t_rx = @elapsed begin
    global rx = infer_backdoor_effect(g_oocyst, df_oocyst, 1, 5; node_names = nm, iterations = 30)
end
println("RxInfer τ_mean = ", round(rx.τ_mean; digits = 3), "  (", round(t_rx; digits = 3), " s)")

Turing.@model function oocyst_ate(A, O)
    τ ~ Normal(0, 5)
    μ0 ~ Normal(0, 5)
    σ ~ truncated(Normal(1, 1); lower = 0.05)
    for i in eachindex(O)
        O[i] ~ Normal0 + τ * A[i], σ)
    end
end

t_tu = @elapsed begin
    global ch_ate = sample(oocyst_ate(df_oocyst.A, df_oocyst.O), NUTS(0.8), 400; progress = false)
end
println("Turing τ_mean = ", round(mean(ch_ate[:τ]); digits = 3), "  (", round(t_tu; digits = 3), " s)")
println("Structural total = ", round(τ_true; digits = 3))
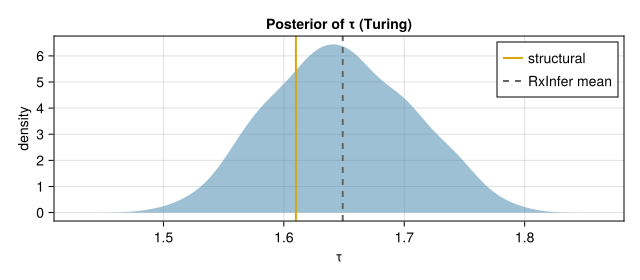
RxInfer τ_mean = 1.649  (9.332 s)
Turing τ_mean = 1.647  (4.55 s)
Structural total = 1.61

Posterior for the total-effect slope \(\tau\) (Turing NUTS) against the structural value \(\beta_A+\beta_C\alpha_A\). RxInfer reports a matching variational mean on demeaned \((O,A)\).

Prefer RxInfer when \(N\) is large and the head stays conjugate after residualisation; use Turing when you need flexible likelihoods or joint posteriors over several parameters. Re-run scripts/bayesian_benchmarks.jl to refresh timing rows.

If a latent \(U\) later confounds \(Q\) and \(O\), the total effect of \(A\) remains backdoor-empty, but effects of \(Q\) on \(O\) are no longer identified without measuring \(U\) (or stronger assumptions). That is the same partial-identification posture as in Chapter 7.

7.5 Causal Mediation Analysis

Mediation analysis decomposes the total effect of a treatment on an outcome into direct and indirect effects transmitted through intermediate variables (mediators) (VanderWeele 2015; Pearl 2009). This section extends the identification framework to answer: How much of the effect of \(X\) on \(Y\) operates through mediator \(M\) versus directly?

7.5.1 Direct and Indirect Effects

Consider a treatment \(X\), mediator \(M\), and outcome \(Y\) with structure \(X \to M \to Y\) and possibly \(X \to Y\) directly. The total effect (TE) is:

\[ TE = \mathbb{E}[Y \mid do(X=1)] - \mathbb{E}[Y \mid do(X=0)] \]

The Natural Direct Effect (NDE) captures the effect of changing \(X\) while holding \(M\) at its natural value under control:

\[ NDE = \mathbb{E}[Y_{1, M_0}] - \mathbb{E}[Y_{0, M_0}] \]

Here \(Y_{x, M_{x'}}\) denotes the counterfactual outcome when \(X\) is set to \(x\) and \(M\) is set to its value under \(X = x'\). The Natural Indirect Effect (NIE) captures the effect of changing \(M\) from its natural value under control to its natural value under treatment, while holding \(X\) at control:

\[ NIE = \mathbb{E}[Y_{0, M_1}] - \mathbb{E}[Y_{0, M_0}] \]

These effects decompose the total effect on the difference scale:

\[ TE = NDE + NIE \]

The counterfactual definitions use nested counterfactuals \(Y_{x, M_{x'}}\): the outcome when we set \(X = x\) and \(M\) to whatever value it would have taken under \(X = x'\). Under sequential ignorability (no unmeasured confounding of the \(X\)\(M\) relationship and no unmeasured confounding of the \(M\)\(Y\) relationship given \(X\)) the NDE and NIE are identified from observational data (Imai et al. 2010).

7.5.2 Path-Specific Effects

Path-specific effects generalise mediation to arbitrary causal pathways (Avin et al. 2005). For the graph \(X \to M \to Y\) with direct edge \(X \to Y\):

  • Path through M (indirect): \(X \to M \to Y\)
  • Direct path: \(X \to Y\)

The Avin–Shpitser–Pearl framework provides graphical conditions for when path-specific effects are identifiable. A key concept is the recanting witness criterion: a variable \(W\) is a “recanting witness” for path set \(\pi\) if it lies on a path in \(\pi\) and also on a path not in \(\pi\) from \(X\) to \(Y\). When such a witness exists, path-specific effects may not be identifiable without additional assumptions.

Path-specific effects are identifiable when we can express them in terms of observable (or experimentally accessible) distributions using the do-calculus or equivalent graphical criteria.

7.5.3 Sensitivity Analysis for Mediation

A critical concern in mediation analysis is unmeasured confounding of the \(M\)\(Y\) relationship. Even when \(X\) is randomised, unmeasured confounders of \(M\) and \(Y\) can bias estimates of the indirect effect (Imai et al. 2010; VanderWeele 2015).

Sensitivity analysis for mediation introduces parameters that quantify the strength of unmeasured confounding and examines how the NDE and NIE estimates change. This allows researchers to assess robustness: how strong would unmeasured confounding need to be to explain away the observed mediation effect?

For a comprehensive treatment of sensitivity analysis, including mediation-specific approaches, see Sensitivity and Robustness.

7.5.4 Connection to Dynamical Mediation

In dynamical systems, mediation corresponds to temporal pathways through intermediate variables. The state-space model naturally captures mediation through latent states: the transition \(X_t \to X_{t+1}\) may operate partly through an intermediate state \(M_t\), and the observation \(Y_t = h(X_t)\) reflects the mediated pathway.

Continuous-time mediation appears in ODE systems through coupling terms: the effect of one variable on another may be direct (e.g., \(\dot{Y} = f(Y, X)\)) or mediated through an intermediate variable (e.g., \(\dot{M} = g(M, X)\), \(\dot{Y} = h(Y, M)\)). The identification of direct vs indirect pathways in dynamical systems extends the static mediation framework to temporal settings.

7.5.5 Identifying Direct vs Indirect Paths

Path enumeration supports mediation analysis: directed pathways from treatment to outcome, and backdoor paths that must be blocked. The helpers below illustrate that logic in code.

# Find project root and include ensure_packages.jl
project_root = let
    current = pwd()
    while !isfile(joinpath(current, "Project.toml")) && !isfile(joinpath(current, "_quarto.yml"))
        parent = dirname(current)
        parent == current && break
        current = parent
    end
    current
end
include(joinpath(project_root, "scripts", "ensure_packages.jl"))
@auto_using CausalDynamics Graphs

# Mediation structure: X → M → Y, X → Y
# Nodes: 1=X (treatment), 2=M (mediator), 3=Y (outcome)
g = DiGraph(3)
add_edge!(g, 1, 2)  # X → M
add_edge!(g, 2, 3)  # M → Y
add_edge!(g, 1, 3)  # X → Y (direct path)

# Enumerate directed (causal) paths from X to Y
directed_paths = CausalDynamics.find_directed_paths(g, 1, 3)
# Result: [[1, 3], [1, 2, 3]]
# - [1, 3]: direct path X → Y
# - [1, 2, 3]: indirect path X → M → Y

# Check for backdoor paths (confounding)
backdoor_paths = CausalDynamics.find_backdoor_paths(g, 1, 3)
# Result: [] — no backdoor paths if no confounders

# With confounder Z: Z → X, Z → M, Z → Y
g_conf = DiGraph(4)
add_edge!(g_conf, 4, 1)  # Z → X
add_edge!(g_conf, 4, 2)  # Z → M
add_edge!(g_conf, 4, 3)  # Z → Y
add_edge!(g_conf, 1, 2)  # X → M
add_edge!(g_conf, 2, 3)  # M → Y
add_edge!(g_conf, 1, 3)  # X → Y

# Backdoor paths from X to Y must be blocked for identification
backdoor_paths_conf = CausalDynamics.find_backdoor_paths(g_conf, 1, 3)
# Identifies paths through Z that require adjustment
5-element Vector{Vector{Int64}}:
 [1, 4, 1, 2, 3]
 [1, 4, 1, 3]
 [1, 4, 2, 3]
 [1, 4, 2, 1, 3]
 [1, 4, 3]

This enumeration helps structure the identification problem: each directed path corresponds to a potential pathway (direct or indirect), and backdoor paths indicate which variables must be adjusted to isolate causal effects.

7.6 The Limits of “Just Fit a Big Model”

A common mistake: “I’ll just fit a flexible model with all variables.”

Problem: Without causal structure, flexible models may:

  • Adjust for colliders (opening backdoor paths)
  • Fail to adjust for confounders
  • Produce biased estimates

Solution: Use causal structure (graph) to guide adjustment.

7.7 Threats to Validity and Bias

Identification theory helps us understand when causal effects can be learned from data. However, even when effects are identified in principle, bias can prevent valid inference in practice (Rothman et al. 2021). Understanding different types of bias is essential for designing studies and interpreting results.

7.7.1 Types of Bias

Epidemiological research distinguishes three main types of bias (Rothman et al. 2021):

  1. Confounding: A confounder is a variable that causes both treatment and outcome, creating a spurious association. This is the focus of identification theory, we use causal graphs to identify confounders and adjust for them.

  2. Selection bias: Occurs when the selection of subjects into the study depends on both treatment and outcome. For example, if only survivors are included in a study, the association between treatment and outcome may be biased.

  3. Information bias (measurement error): Occurs when variables are measured with error, or when measurement error differs between treatment groups. This includes misclassification of exposure, outcome, or confounders.

7.7.2 Confounding in Detail

Confounding is a special concern because it creates spurious associations that can be mistaken for causal effects (Pearl 2009; Rothman et al. 2021). A confounder \(L\) must satisfy three conditions:

  1. \(L\) is associated with treatment \(A\)
  2. \(L\) is associated with outcome \(Y\) (conditional on treatment)
  3. \(L\) is not on the causal pathway from \(A\) to \(Y\)

The backdoor criterion (see Graph Theory and Causal Patterns) provides a graphical method to identify which variables must be adjusted for to eliminate confounding (Pearl 2009). However, in practice, we must also consider:

7.7.3 Sensitivity Analysis for Unmeasured Confounding

When unmeasured confounding is suspected, sensitivity analysis quantifies how robust results are to assumptions about unmeasured confounders (Rothman et al. 2021). Common approaches:

  1. E-value: The minimum strength of association that an unmeasured confounder would need to have with both treatment and outcome to explain away the observed effect (VanderWeele and Ding 2017)

  2. Sensitivity parameters: Specify the strength of unmeasured confounding and compute how results change

  3. Bounds: Compute worst-case bounds on the causal effect under assumptions about unmeasured confounding

Example: If an observed treatment effect has an E-value of 2.5, this means an unmeasured confounder would need to have an odds ratio of at least 2.5 with both treatment and outcome to explain away the effect. This helps assess the plausibility of unmeasured confounding (VanderWeele and Ding 2017).

After identification, estimation of continuous MTP and mediation estimands is handled by CausalTargeted.jl (Ch. 20–23), which also exposes Cinelli–Hazlett-inspired partial-\(R^2\) tipping-point helpers (sensitivity_report) complementary to E-values (Cinelli and Hazlett 2020).

7.8 Partial Identification

When full identification is impossible, we may still obtain bounds:

  • Non-parametric bounds: Range of possible values
  • Sensitivity analysis: How results change with assumptions
  • Robustness: Worst-case scenarios

7.9 Stratum context

This chapter addresses Doing in the Structural stratum: how can we determine when perfect causal structure can be identified from data? Identification is a centrifugal bridge concept (Structural → Observable): it applies structural principles (graph structure, do-calculus) to determine what can be learned from observable data. Identification theory provides the bridge from perfect forms (Structural) to what can be learned from observations (Observable stratum).

7.10 Summary

Always separate estimand, identification, and estimator. Graphical criteria (backdoor, frontdoor, IV) and do-calculus answer when an estimand is a functional of the observational law; mediation decomposes total effects when sequential ignorability (or path-specific criteria) hold. Flexible outcome models do not replace structure. When full identification fails, report bounds or sensitivity rather than a false point. The poultry assay shows the workflow in miniature: build \(G\), check independencies and adjustment sets, estimate interventional contrasts under a known GraphSCM, then recover \(\tau\) with RxInfer (VI) or Turing (NUTS).

7.11 Further Reading

  • Pearl (2009): Causality, Chapters 3-4
  • Shpitser and Pearl (2006): “Identification of joint interventional distributions”
  • Bareinboim and Pearl (2012): “Causal transportability”
  • VanderWeele (2015): Explanation in Causal Inference: comprehensive treatment of mediation and path-specific effects
  • Imai et al. (2010): “Identification, inference, and sensitivity analysis for causal mediation effects”
  • Cinelli and Hazlett (2020): Making sense of sensitivity (partial \(R^2\) / robustness value)
  • Chernozhukov et al. (2024): Applied Causal Inference Powered by ML and AI, Chapters 5, 7, and 11 (ignorability, backdoor in DAGs/SEMs, good and bad controls; front-door in Ch. 11.A; IV and sensitivity in Ch. 12)
  • TMLE and Doubly Robust Estimation: From ID to estimation
  • Policy Evaluation: Continuous MTP grids
  • Avin et al. (2005): “Identifiability of path-specific effects”
  • Rothman et al. (2021): Modern Epidemiology (4th ed.), comprehensive coverage of confounding, bias, threats to validity, and causal diagrams
  • Do-Calculus: Rules for Interventions: Symbolic approach to identification